
TradingView A股增强指标
涨停、炸板、连板与缺口
一张图看清
在 TradingView 上查看 A 股行情时,K 线本身可以呈现价格变化,但涨停、跌停、炸板、连板等具有 A 股市场特点的信息,往往还需要投资者自己识别和整理。
为减少这些重复判断,我制作了一个 TradingView A股增强指标。它不预测行情,也不提供买卖信号,而是把看盘时常用的客观信息直接整理到图表上,让涨跌停事件、连板情况、未回补缺口以及当前周期数据更加直观。
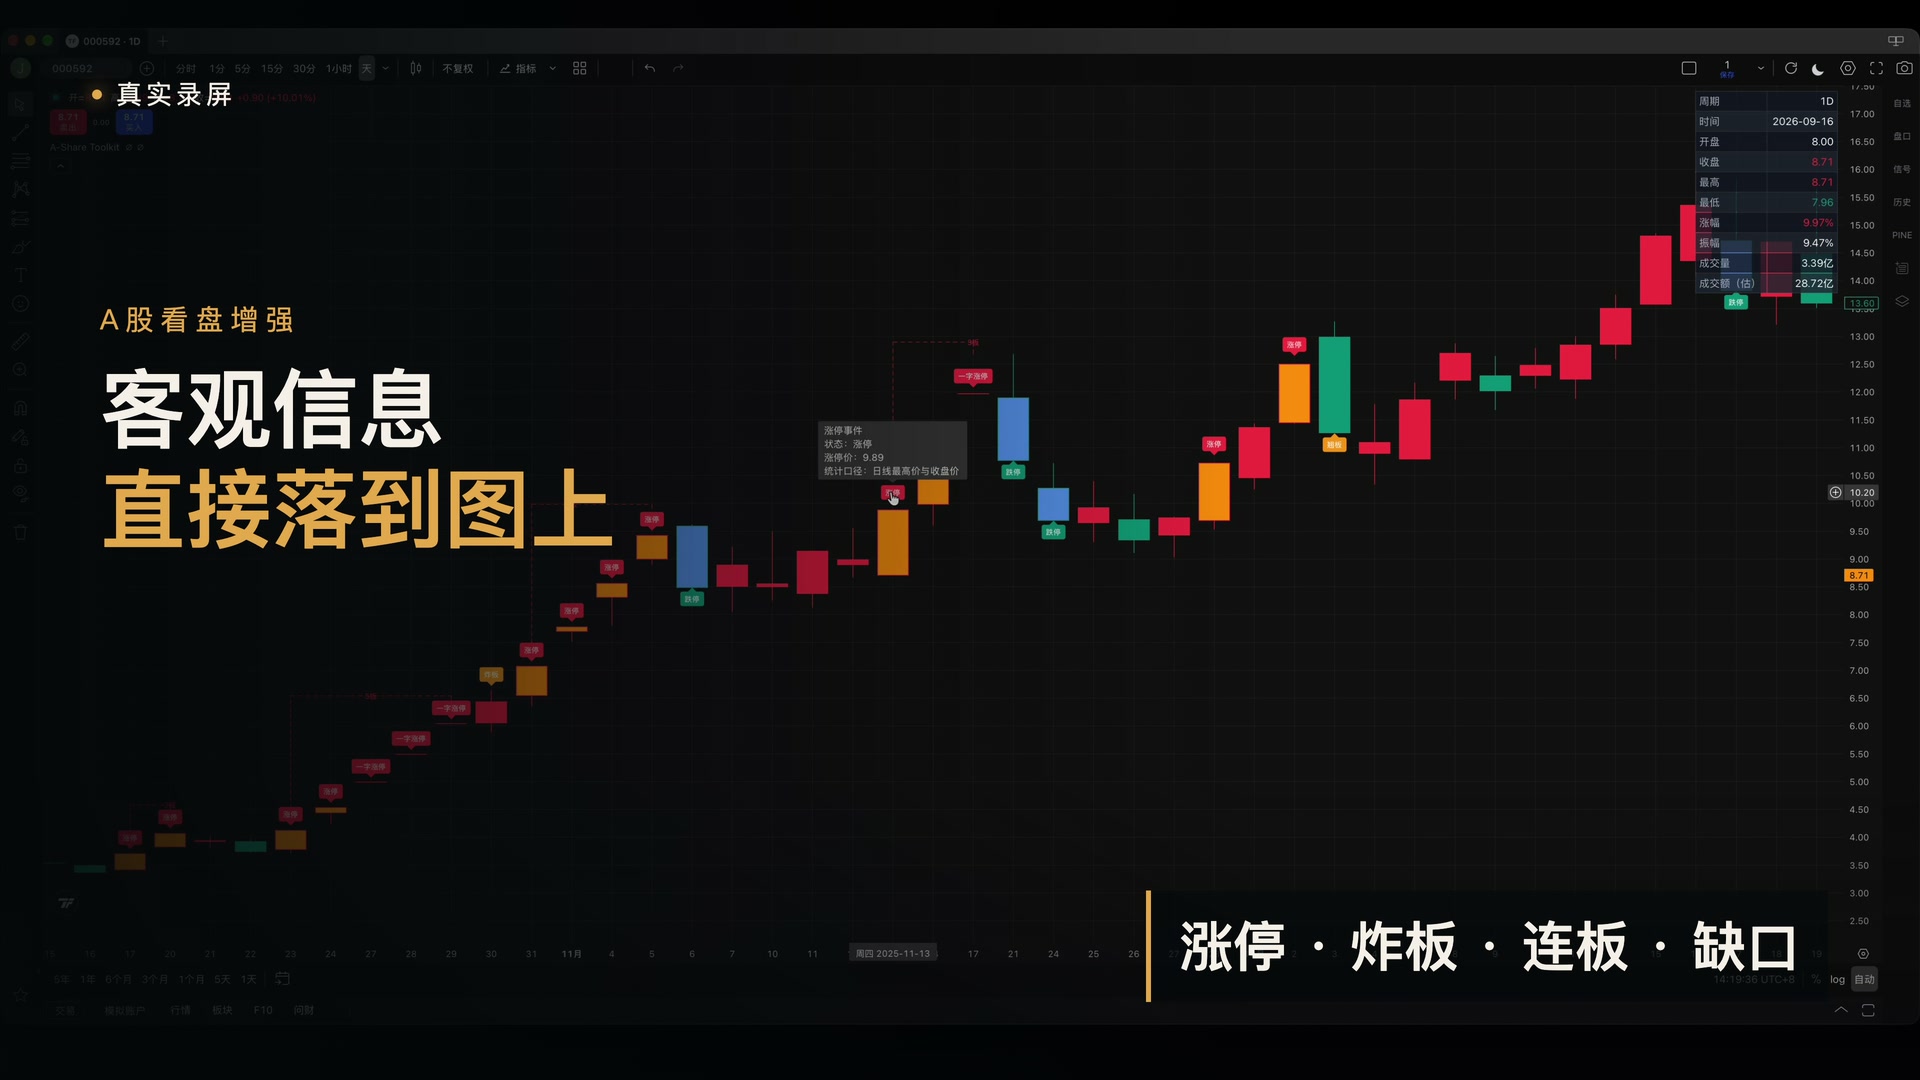
涨停、跌停与开板事件直接标记
指标会对涨停和跌停 K 线进行颜色区分,同时在图表上显示相应的事件标签。
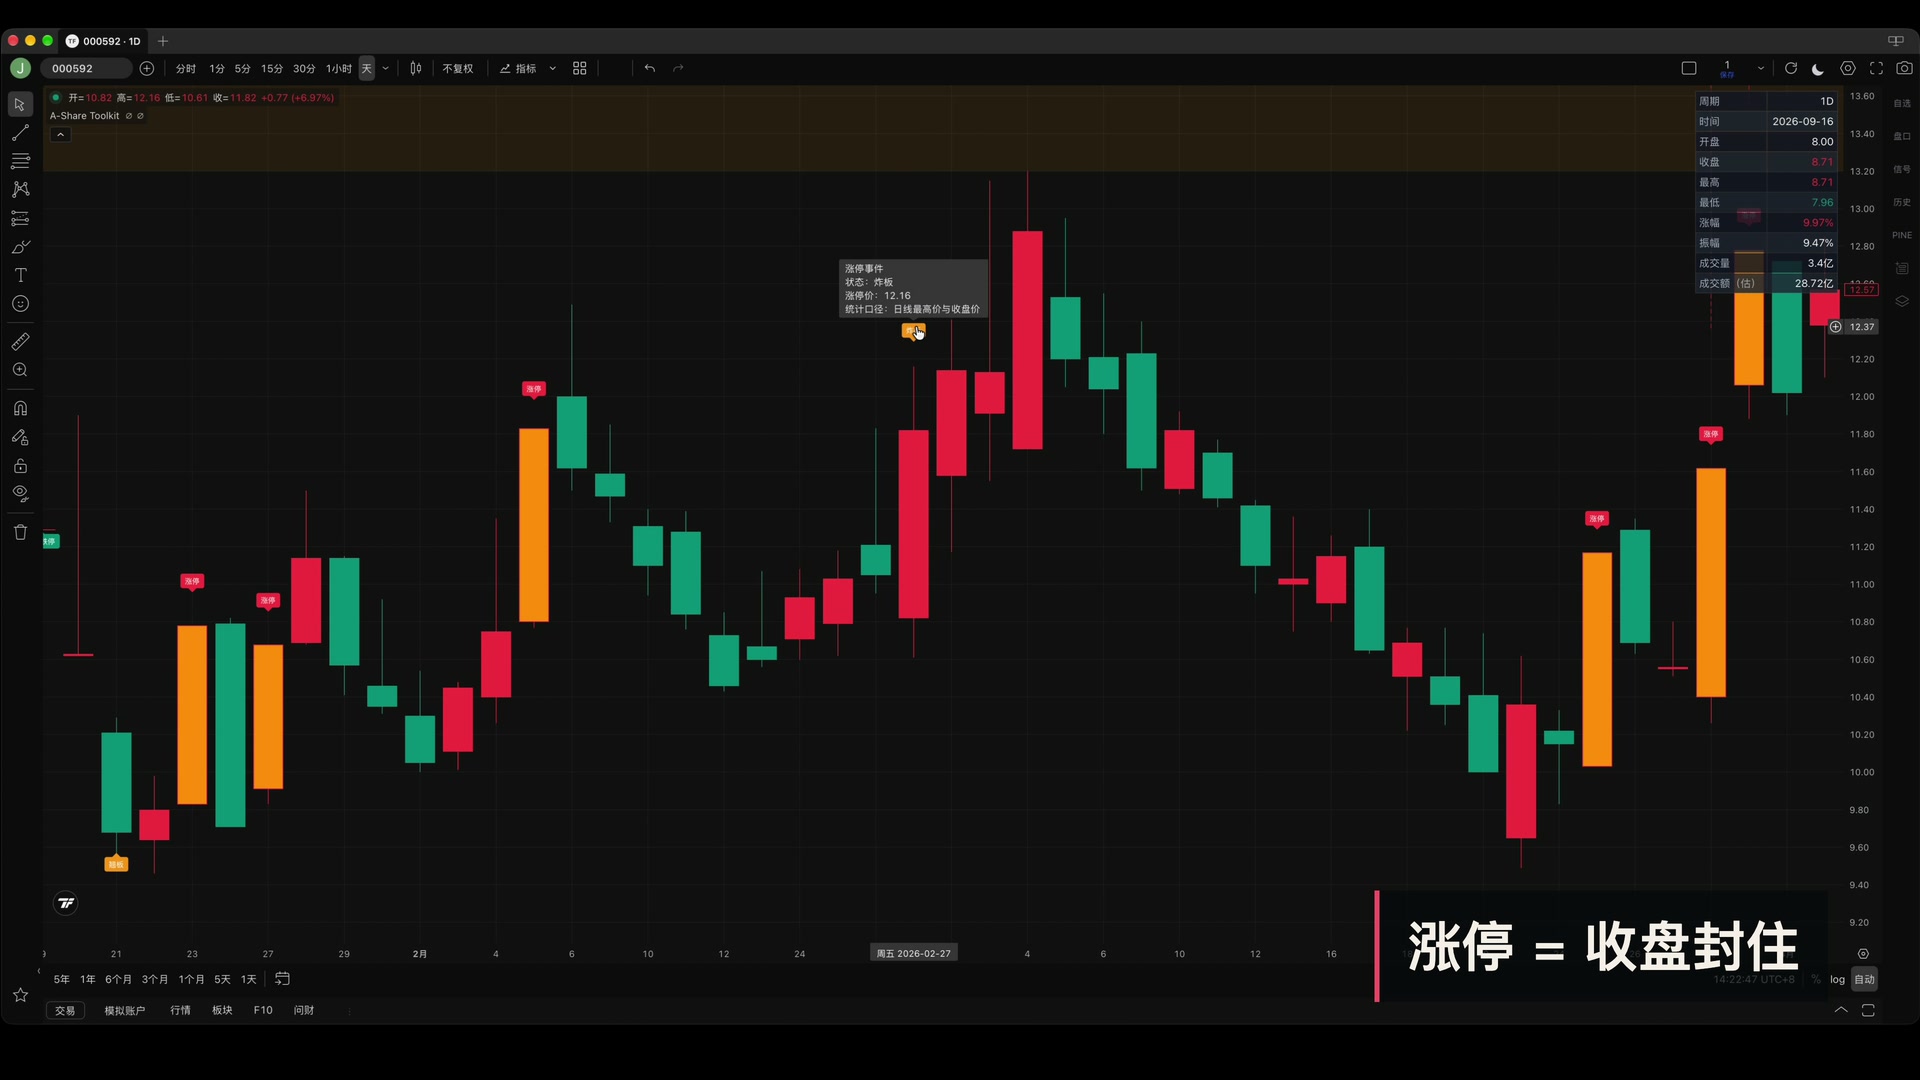
当股票盘中最高价触及涨停价,并且收盘仍然封在涨停价时,图表会将其标记为“涨停”;如果盘中触及涨停价,但收盘没有封住,则会标记为“炸板”。
跌停采用相同的判断方式:收盘封在跌停价时标记为“跌停”,盘中触及跌停后又打开则标记为“翘板”。如果当天的开盘价、最高价、最低价和收盘价全部处于涨停价,还会单独识别为“一字涨停”。
这些标签并不是额外的行情判断,而是把原本隐藏在价格数据中的事件直接显示出来,查看历史走势时不必再逐根 K 线核对。
自动适配不同板块的涨跌幅规则
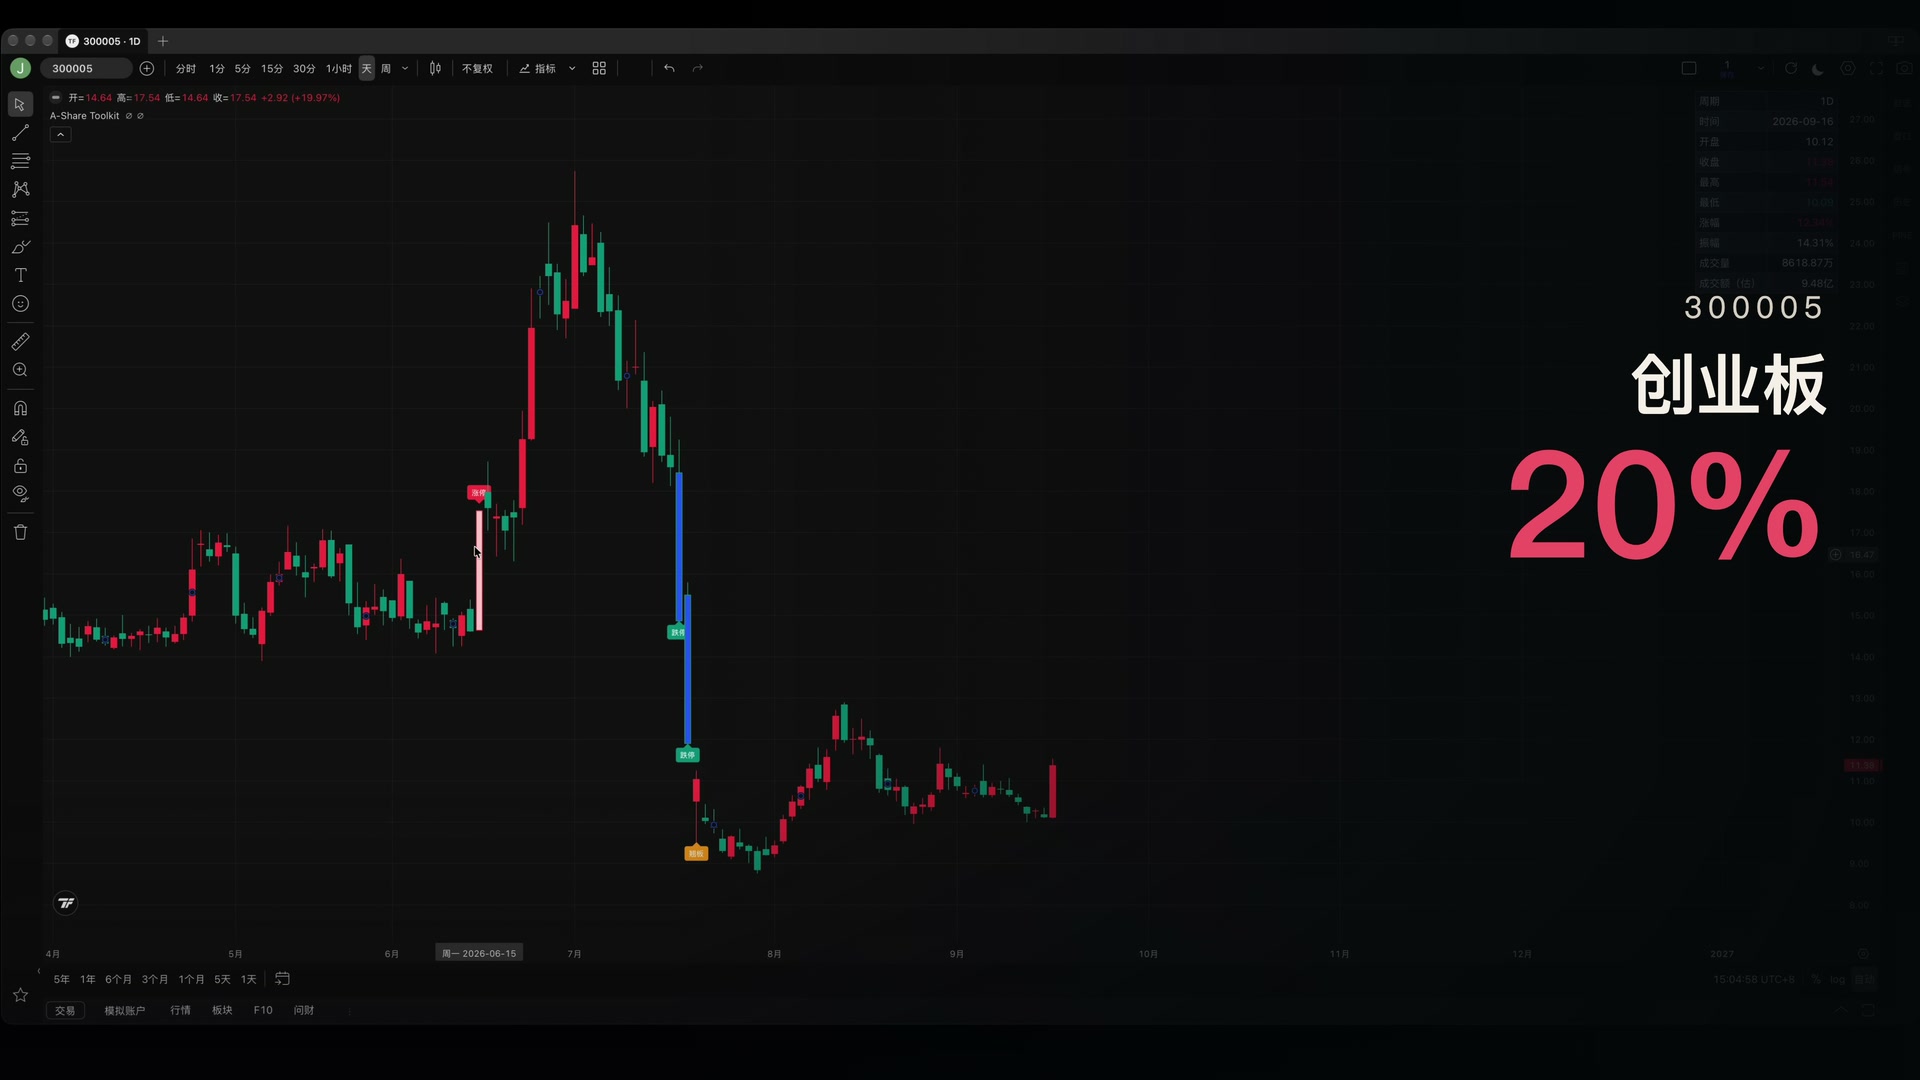
A 股不同板块的涨跌幅限制并不完全相同。指标会根据股票所属市场自动应用相应规则:
- 主板通常按 10% 处理;
- 创业板和科创板通常按 20% 处理;
- 北京证券交易所通常按 30% 处理。
切换股票时不需要手动修改参数,指标会自动重新判断相应的涨跌停价格。
分钟图只保留当天第一次封板位置
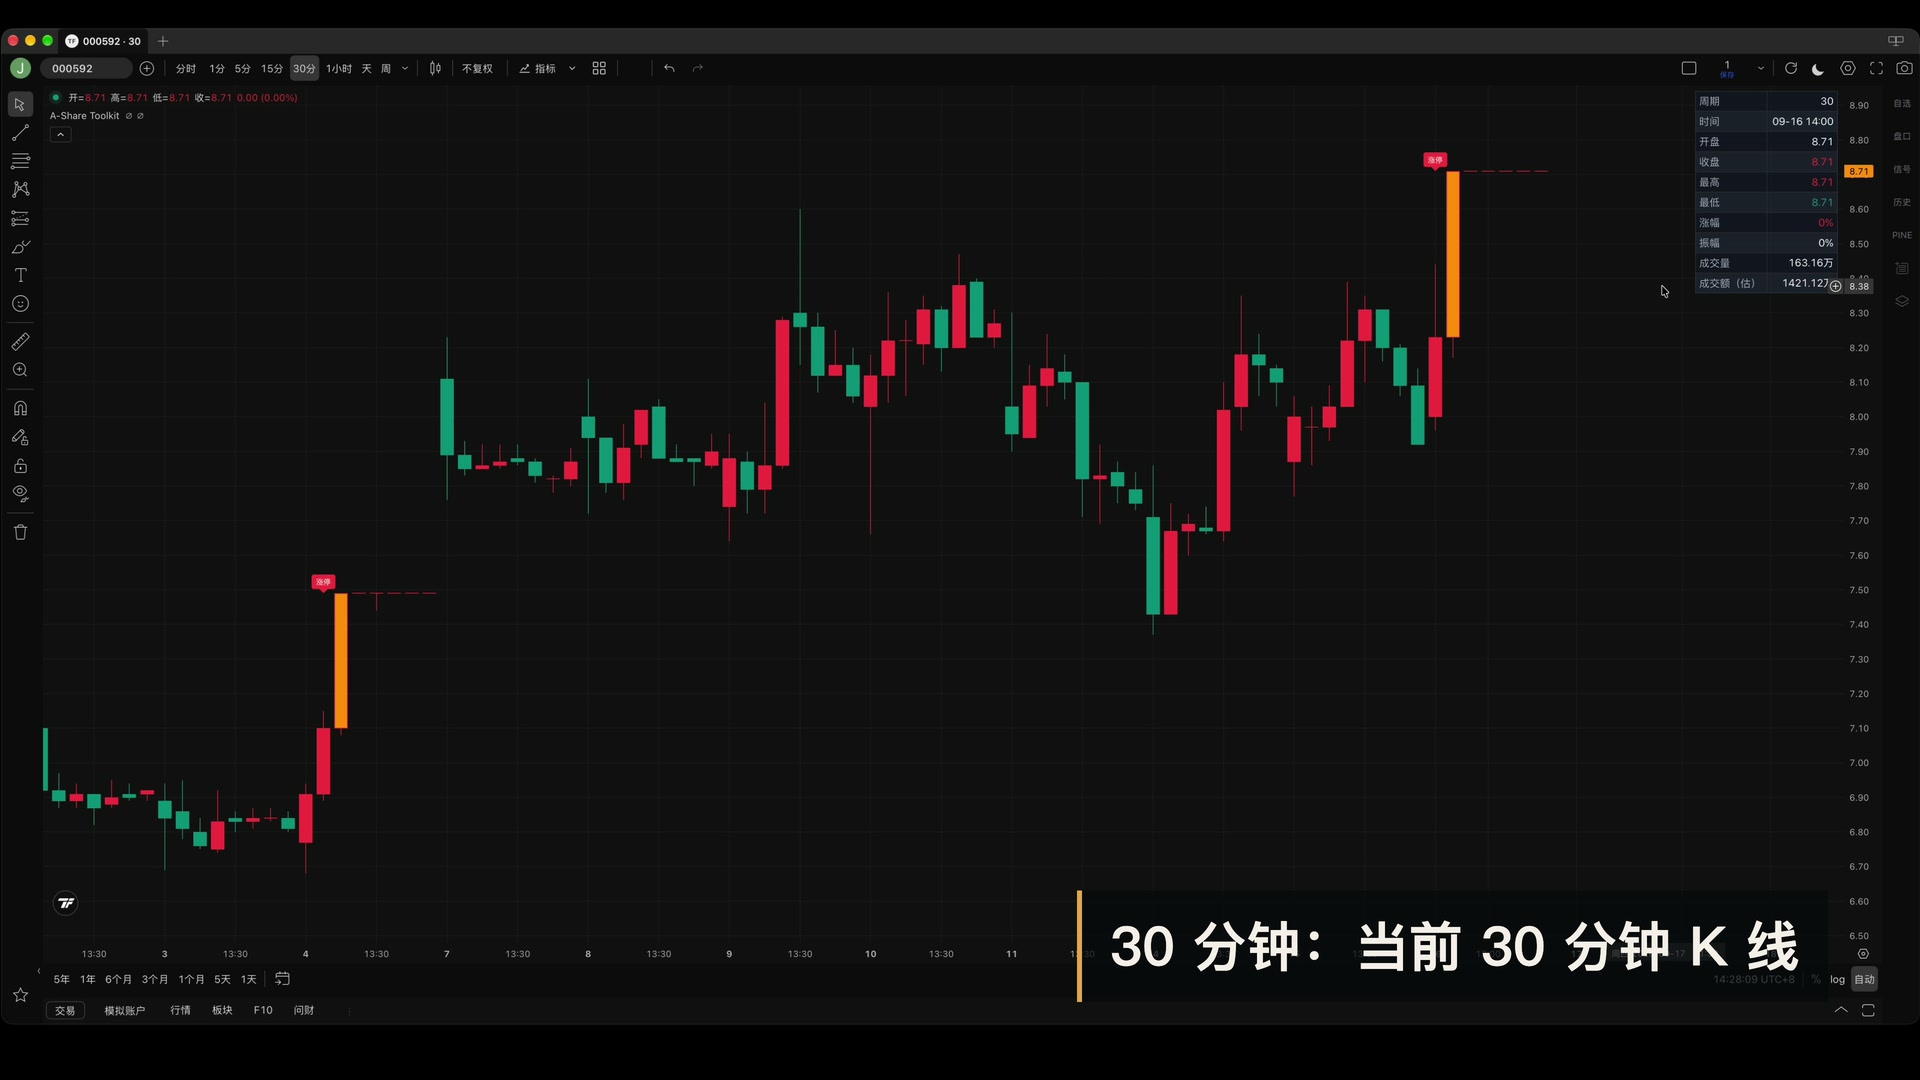
在分钟周期中,一只股票封板后,后续可能有几十根 K 线都收在涨停价。如果每根 K 线都显示“涨停”标签,画面很快就会被重复信息占满。
因此,分钟图采用了单独的显示逻辑:每个交易日只标记第一次收盘达到涨停价的 K 线,跌停也采用同样的处理方式。
这样既能看到当天第一次真正收盘封板的位置,也能避免大量重复标签影响图表阅读。

自动显示连续涨停板数
在日线周期中,如果股票连续多个交易日涨停,指标会自动连接这一段行情,并显示当前连板数量。
连续两个涨停显示为“2板”,连续三个涨停显示为“3板”,更高的连板也会继续累计。这个功能不对连板行情作强弱评价,只是把原本需要手动计算的信息直接呈现在图表上。

标出尚未回补的跳空缺口
当当天开盘价直接跳过前一交易日的最高价时,两者之间会形成向上跳空缺口;向下跳空则采用对应的判断逻辑。
指标会把这些缺口区域绘制在图表上,并持续保留尚未回补的部分,方便观察价格后续是否重新进入缺口区域。

随图表周期变化的信息面板
图表右上角还提供了一个简洁的信息面板,显示:
- 当前周期与时间;
- 开盘价、收盘价、最高价和最低价;
- 涨跌幅与振幅;
- 成交量与估算成交额。
面板数据会跟随图表周期变化。在 30 分钟图中,它显示当前 30 分钟 K 线的数据;切换到日线后显示日线数据;切换到周线后,则显示当前周的数据。
使用时需要了解的限制
这个指标以 TradingView 和 Pine 能够获得的数据为基础,因此有两个边界需要提前说明。
第一,Pine 无法获得一只股票在每个历史交易日真实、完整的 ST 状态。如果某只股票历史上曾经被 ST,之后又摘帽,部分历史区间的涨跌停识别可能存在误差。
第二,新股上市初期可能存在不设涨跌幅限制的特殊交易阶段,当前版本没有自动处理这些阶段。查看新股上市初期行情时,需要结合实际交易规则自行确认。
让图表负责整理信息,而不是替代判断
这个 A 股增强指标的定位很明确:不预测涨跌,不生成买卖信号,也不替代交易决策。它所做的,是把涨停、跌停、炸板、翘板、连板、缺口和周期数据等客观信息统一整理到图表上。
打开图表后,常用信息能够更快被识别;切换股票和周期时,也不需要反复进行相同的手动判断。对于经常使用 TradingView 查看 A 股行情的用户,它可以让图表更贴近 A 股市场的实际看盘习惯。
//@version=6
indicator("A股信息增强", "A-Share Toolkit", overlay = true, behind_chart = false,
max_labels_count = 500, max_lines_count = 500, max_boxes_count = 500)
// ============================================================================
// China A-Share Market Toolkit
// 设计目标:补齐国内用户常用的客观看盘信息,不提供买卖判断。
// 涨跌停事件在1日图按当日最高、最低和收盘价判断,不请求分钟数据。
// 历史范围默认:最近365个自然日。
//
// 已知边界:
// 1) TradingView/Pine 没有逐日 ST 历史状态。本脚本仅用“当前证券名称是否以 ST/*ST 开头”
// 作为 2026-07-06 之前主板 5% 风险警示规则的近似,不保证个股历史 ST 完全正确。
// 2) 新股上市初期无涨跌幅限制、退市整理/重新上市等特殊情形 V1 不自动处理。
// 3) 日线无法区分“全天封死”与“炸开后再次封住”,因此本版不显示回封次数和首次时间。
// ============================================================================
// ─────────────────────────────────────────────────────────────────────────────
// 01. 输入设置
// ─────────────────────────────────────────────────────────────────────────────
string GRP_GENERAL = "01|通用"
string GRP_LIMIT = "02|涨跌停"
string GRP_STREAK = "03|连板"
string GRP_GAP = "04|缺口"
string GRP_TABLE = "05|信息面板"
int lookbackDays = input.int(
365,
"历史范围(自然日)",
minval = 30,
maxval = 730,
group = GRP_GENERAL,
tooltip = "事件标签、连板线和缺口只处理最近 N 个自然日。默认365天。")
string limitRuleInput = input.string(
"自动",
"涨跌幅规则",
options = ["自动", "5%", "10%", "20%", "30%", "无限制"],
group = GRP_GENERAL,
tooltip = "自动:根据交易所/代码判断。特殊证券或自动识别不符合实际时,可手动覆盖。")
// ─────────────────────────────────────────────────────────────────────────────
// 涨跌停显示
// K线染色和事件标签使用两套独立颜色
// ─────────────────────────────────────────────────────────────────────────────
bool showLimitBody = input.bool(
true,
"K线染色",
group = GRP_LIMIT,
inline = "body")
// K线染色:橙 / 蓝
color upBodyColor = input.color(
#FF9800,
"涨停",
group = GRP_LIMIT,
inline = "body",
active = showLimitBody)
color downBodyColor = input.color(
#5B9CF6,
"跌停",
group = GRP_LIMIT,
inline = "body",
active = showLimitBody)
bool showEventLabels = input.bool(
true,
"事件标签",
group = GRP_LIMIT,
inline = "lbl")
string eventLabelSizeInput = input.string(
"小",
"字号",
options = ["极小", "小", "正常", "大"],
group = GRP_LIMIT,
inline = "lbl",
active = showEventLabels)
// 事件标签:保持原来的红 / 绿
color upLabelColor = input.color(
#F23645,
"涨停",
group = GRP_LIMIT,
inline = "lblcol",
active = showEventLabels)
color downLabelColor = input.color(
#089981,
"跌停",
group = GRP_LIMIT,
inline = "lblcol",
active = showEventLabels)
color eventWarnColor = input.color(
#F59E0B,
"炸板/翘板",
group = GRP_LIMIT,
inline = "lblcol",
active = showEventLabels)
color eventTextColor = input.color(
color.white,
"文字",
group = GRP_LIMIT,
inline = "lblcol",
active = showEventLabels)
bool showLimitLines = input.bool(
false,
"涨跌停价线",
group = GRP_LIMIT,
inline = "limitline")
int limitLineWidth = input.int(
1,
"线宽",
minval = 1,
maxval = 4,
group = GRP_LIMIT,
inline = "limitline",
active = showLimitLines)
color upLimitLineColor = input.color(
color.new(#F23645, 35),
"涨停",
group = GRP_LIMIT,
inline = "limitlinecolor",
active = showLimitLines)
color downLimitLineColor = input.color(
color.new(#089981, 35),
"跌停",
group = GRP_LIMIT,
inline = "limitlinecolor",
active = showLimitLines)
// ─────────────────────────────────────────────────────────────────────────────
// 连板
// ─────────────────────────────────────────────────────────────────────────────
bool showStreakLines = input.bool(
true,
"连板连接线(仅1日图)",
group = GRP_STREAK,
inline = "streakmain",
tooltip = "连板是日线属性。V1仅在1日图上绘制连接线和板数文字。")
string streakLineStyleInput = input.string(
"虚线",
"线型",
options = ["实线", "虚线", "点线"],
group = GRP_STREAK,
inline = "streakmain",
active = showStreakLines)
// 默认字号:小
string streakTextSizeInput = input.string(
"小",
"字号",
options = ["极小", "小", "正常"],
group = GRP_STREAK,
inline = "streakmain",
active = showStreakLines)
color streakLineColor = input.color(
color.new(#F23645, 25),
"连线",
group = GRP_STREAK,
inline = "streakstyle",
active = showStreakLines)
color streakTextColor = input.color(
#F23645,
"文字",
group = GRP_STREAK,
inline = "streakstyle",
active = showStreakLines)
int streakLineWidth = input.int(
1,
"线宽",
minval = 1,
maxval = 3,
group = GRP_STREAK,
inline = "streakstyle",
active = showStreakLines)
// ─────────────────────────────────────────────────────────────────────────────
// 缺口
// ─────────────────────────────────────────────────────────────────────────────
int maxGapCount = input.int(
5,
"最多保留缺口数量",
minval = 1,
maxval = 150,
group = GRP_GAP,
inline = "gap",
tooltip = "图上最多保留的未回补缺口数量,超出时优先删除最早的缺口。")
color gapColor = input.color(
color.new(#F59E0B, 88),
"缺口颜色",
group = GRP_GAP,
inline = "gap")
// ─────────────────────────────────────────────────────────────────────────────
// TABLE
// ─────────────────────────────────────────────────────────────────────────────
bool showTable = input.bool(
true,
"显示信息面板",
group = GRP_TABLE,
inline = "tbmain")
string tablePositionInput = input.string(
"右上",
"位置",
options = ["右上", "左上", "右下", "左下", "右中", "左中"],
group = GRP_TABLE,
inline = "tbmain",
active = showTable)
// 默认字号:正常
string tableTextSizeInput = input.string(
"正常",
"字号",
options = ["极小", "小", "正常", "大"],
group = GRP_TABLE,
inline = "tbmain",
active = showTable)
color tableBg = input.color(
color.new(#111827, 18),
"普通行",
group = GRP_TABLE,
inline = "tb1",
active = showTable)
color tableAltBg = input.color(
color.new(#1F2937, 18),
"交替行",
group = GRP_TABLE,
inline = "tb1",
active = showTable)
color tableLabelColor = input.color(
#AAB2C0,
"字段",
group = GRP_TABLE,
inline = "tb2",
active = showTable)
color tableValueColor = input.color(
color.white,
"数值",
group = GRP_TABLE,
inline = "tb2",
active = showTable)
color tablePositiveColor = input.color(
#F23645,
"上涨/涨停",
group = GRP_TABLE,
inline = "tb3",
active = showTable)
color tableNegativeColor = input.color(
#089981,
"下跌/跌停",
group = GRP_TABLE,
inline = "tb3",
active = showTable)
color tableBorderColor = input.color(
color.new(color.gray, 70),
"边框",
group = GRP_TABLE,
inline = "tb4",
active = showTable)
int tableBorderWidth = input.int(
1,
"宽度",
minval = 0,
maxval = 3,
group = GRP_TABLE,
inline = "tb4",
active = showTable)
// ─────────────────────────────────────────────────────────────────────────────
// 02. 辅助函数
// ─────────────────────────────────────────────────────────────────────────────
f_textSize(string s) =>
switch s
"极小" => size.tiny
"小" => size.small
"正常" => size.normal
"大" => size.large
=> size.small
f_lineStyle(string s) =>
switch s
"实线" => line.style_solid
"点线" => line.style_dotted
=> line.style_dashed
f_tablePosition(string s) =>
switch s
"左上" => position.top_left
"右下" => position.bottom_right
"左下" => position.bottom_left
"右中" => position.middle_right
"左中" => position.middle_left
=> position.top_right
// TV 使用标准交易所前缀;TF 的 Pine 上下文可能不给 prefix,因此再按 A 股代码段识别。
f_isSSE() =>
str.startswith(syminfo.prefix, "SSE") or
syminfo.prefix == "SH" or
str.startswith(syminfo.ticker, "60") or
str.startswith(syminfo.ticker, "68")
f_isSZSE() =>
str.startswith(syminfo.prefix, "SZSE") or
syminfo.prefix == "SZ" or
str.startswith(syminfo.ticker, "00") or
str.startswith(syminfo.ticker, "30")
f_isBSE() =>
str.startswith(syminfo.prefix, "BSE") or
str.startswith(syminfo.prefix, "BJSE") or
syminfo.prefix == "BJ" or
(
syminfo.prefix == "" and
(
str.startswith(syminfo.ticker, "4") or
str.startswith(syminfo.ticker, "8") or
str.startswith(syminfo.ticker, "92")
)
)
f_isSTAR() =>
f_isSSE() and
(
str.startswith(syminfo.ticker, "688") or
str.startswith(syminfo.ticker, "689")
)
f_isSSEMain() =>
f_isSSE() and
str.startswith(syminfo.ticker, "60") and
not f_isSTAR()
f_isChiNext() =>
f_isSZSE() and
(
str.startswith(syminfo.ticker, "300") or
str.startswith(syminfo.ticker, "301")
)
f_isSZSEMain() =>
f_isSZSE() and
str.startswith(syminfo.ticker, "00")
f_isCurrentST() =>
str.startswith(syminfo.description, "ST") or
str.startswith(syminfo.description, "*ST")
int RULE_CHANGE_20260706 = timestamp(
"Asia/Shanghai",
2026,
7,
6,
0,
0)
f_limitPct(int t) =>
float pct = na
if limitRuleInput == "5%"
pct := 0.05
else if limitRuleInput == "10%"
pct := 0.10
else if limitRuleInput == "20%"
pct := 0.20
else if limitRuleInput == "30%"
pct := 0.30
else if limitRuleInput == "无限制"
pct := na
else
if f_isBSE()
pct := 0.30
else if f_isSTAR() or f_isChiNext()
pct := 0.20
else if f_isSSEMain() or f_isSZSEMain()
bool oldRiskWarningProxy =
t < RULE_CHANGE_20260706 and f_isCurrentST()
pct := oldRiskWarningProxy ? 0.05 : 0.10
else
pct := na
pct
f_atUp(float v, float limitPrice) =>
not na(limitPrice) and
v >= limitPrice - syminfo.mintick * 0.25
f_atDown(float v, float limitPrice) =>
not na(limitPrice) and
v <= limitPrice + syminfo.mintick * 0.25
f_price(float v) =>
na(v) ? "—" : str.tostring(v, format.mintick)
f_pct(float v) =>
na(v) ? "—" : str.tostring(v, "#.##") + "%"
f_cnUnit(float v) =>
string result = "—"
if not na(v)
result :=
math.abs(v) >= 100000000 ?
str.tostring(v / 100000000.0, "#.##") + "亿" :
math.abs(v) >= 10000 ?
str.tostring(v / 10000.0, "#.##") + "万" :
str.tostring(v, "#.##")
result
f_upStatus(bool touched, bool locked) =>
touched ? (locked ? "涨停" : "炸板") : "正常"
f_downStatus(bool touched, bool locked) =>
touched ? (locked ? "跌停" : "翘板") : "正常"
// ─────────────────────────────────────────────────────────────────────────────
// 03. 范围、周期、日线基准数据
// ─────────────────────────────────────────────────────────────────────────────
int cutoffTime =
timenow -
lookbackDays * 24 * 60 * 60 * 1000
bool inLookback =
time >= cutoffTime
bool isOneDayChart =
timeframe.period == "1D"
bool intradayAtLeast1m =
timeframe.isintraday and
timeframe.in_seconds() >= 60
bool limitModuleSupported =
isOneDayChart or intradayAtLeast1m
bool newDay =
timeframe.change("1D")
// 用主图K线逐日归并,避免同品种同周期再发一次 request.security 历史请求。
// 新交易日开始时,先固化上一交易日的高、低、收,再初始化今日累计值。
var float prevDayHigh = na
var float prevDayLow = na
var float prevDayClose = na
var float dayOpenNow = na
var float dayHighNow = na
var float dayLowNow = na
var float dayVolumeNow = na
var float dayEstimatedAmountNow = na
float barEstimatedAmount =
na(volume) ? na : volume * hlc3
if newDay or na(dayHighNow)
if not na(dayHighNow)
prevDayHigh := dayHighNow
prevDayLow := dayLowNow
prevDayClose := close[1]
dayOpenNow := open
dayHighNow := high
dayLowNow := low
dayVolumeNow := volume
dayEstimatedAmountNow := barEstimatedAmount
else
dayHighNow :=
math.max(dayHighNow, high)
dayLowNow :=
math.min(dayLowNow, low)
dayVolumeNow :=
na(dayVolumeNow) or na(volume) ?
na :
dayVolumeNow + volume
dayEstimatedAmountNow :=
na(dayEstimatedAmountNow) or na(barEstimatedAmount) ?
na :
dayEstimatedAmountNow + barEstimatedAmount
float limitPct =
limitModuleSupported ?
f_limitPct(time) :
na
float upLimit =
not na(limitPct) and not na(prevDayClose) ?
math.round_to_mintick(
prevDayClose * (1.0 + limitPct)
) :
na
float downLimit =
not na(limitPct) and not na(prevDayClose) ?
math.round_to_mintick(
prevDayClose * (1.0 - limitPct)
) :
na
// ─────────────────────────────────────────────────────────────────────────────
// 04. 纯日线涨跌停事件
// ─────────────────────────────────────────────────────────────────────────────
bool dayUpTouched =
limitModuleSupported and
inLookback and
not na(limitPct) and
f_atUp(
math.round_to_mintick(dayHighNow),
upLimit
)
bool dayUpLocked =
limitModuleSupported and
inLookback and
not na(limitPct) and
f_atUp(
math.round_to_mintick(close),
upLimit
)
int dayUpBreaks =
dayUpTouched and not dayUpLocked ? 1 : 0
bool dayDownTouched =
limitModuleSupported and
inLookback and
not na(limitPct) and
f_atDown(
math.round_to_mintick(dayLowNow),
downLimit
)
bool dayDownLocked =
limitModuleSupported and
inLookback and
not na(limitPct) and
f_atDown(
math.round_to_mintick(close),
downLimit
)
int dayDownBreaks =
dayDownTouched and not dayDownLocked ? 1 : 0
var int completedUpStreak = 0
// 当天结束后,在下一交易日第一根图表K线上结算上一交易日连板。
if newDay and not barstate.isfirst
completedUpStreak :=
dayUpLocked[1] ?
completedUpStreak + 1 :
0
string currentUpStatus =
f_upStatus(
dayUpTouched,
dayUpLocked
)
string currentDownStatus =
f_downStatus(
dayDownTouched,
dayDownLocked
)
// ─────────────────────────────────────────────────────────────────────────────
// 05. K线实体染色、涨跌停价线、事件标签
// ─────────────────────────────────────────────────────────────────────────────
bool chartBarAtUp =
limitModuleSupported and
f_atUp(
math.round_to_mintick(close),
upLimit
)
bool chartBarAtDown =
limitModuleSupported and
f_atDown(
math.round_to_mintick(close),
downLimit
)
// 这里只使用 K 线染色颜色:橙 / 蓝
color limitBarColor =
showLimitBody ?
(
chartBarAtUp ?
upBodyColor :
chartBarAtDown ?
downBodyColor :
na
) :
na
barcolor(
limitBarColor,
title = "涨跌停K线实体")
plot(
showLimitLines and limitModuleSupported ?
upLimit :
na,
"涨停价",
color = upLimitLineColor,
linewidth = limitLineWidth,
style = plot.style_stepline)
plot(
showLimitLines and limitModuleSupported ?
downLimit :
na,
"跌停价",
color = downLimitLineColor,
linewidth = limitLineWidth,
style = plot.style_stepline)
string upEventText = ""
string downEventText = ""
bool onePriceUp =
isOneDayChart and
chartBarAtUp and
high == low
bool onePriceDown =
isOneDayChart and
chartBarAtDown and
high == low
float dailyVisualRange =
nz(
ta.atr(14),
math.max(
high - low,
syminfo.mintick * 10
)
)
float dailyUpLabelOffset =
math.max(
dailyVisualRange * 0.15,
math.max(
math.abs(high) * 0.006,
syminfo.mintick * 8
)
)
float upEventLabelY =
isOneDayChart ?
high + dailyUpLabelOffset :
high
if isOneDayChart
if dayUpTouched
upEventText :=
onePriceUp ?
"一字涨停" :
dayUpLocked ?
"涨停" :
"炸板"
if dayDownTouched
downEventText :=
onePriceDown ?
"一字跌停" :
dayDownLocked ?
"跌停" :
"翘板"
else
upEventText :=
chartBarAtUp ?
"涨停" :
""
downEventText :=
chartBarAtDown ?
"跌停" :
""
var int lastUpEventLabelTime = na
var label lastUpEventLabel = na
var int lastDownEventLabelTime = na
var label lastDownEventLabel = na
// 分钟周期每个交易日只显示第一次涨停/跌停标签。
var bool intradayUpLabelShownToday = false
var bool intradayDownLabelShownToday = false
if newDay
intradayUpLabelShownToday := false
intradayDownLabelShownToday := false
bool showThisUpEventLabel =
isOneDayChart ?
upEventText != "" :
(
intradayAtLeast1m and
upEventText != "" and
not intradayUpLabelShownToday
)
bool showThisDownEventLabel =
isOneDayChart ?
downEventText != "" :
(
intradayAtLeast1m and
downEventText != "" and
not intradayDownLabelShownToday
)
// ─────────────────────────────────────────────────────────────────────────────
// 涨停 / 炸板标签
// 标签颜色只使用 upLabelColor / eventWarnColor
// 不使用 upBodyColor
// ─────────────────────────────────────────────────────────────────────────────
if showEventLabels and
limitModuleSupported and
inLookback and
showThisUpEventLabel
color thisUpLabelColor =
upEventText == "炸板" ?
eventWarnColor :
upLabelColor
string tip =
isOneDayChart ?
(
"涨停事件\n状态:" +
currentUpStatus +
"\n涨停价:" +
f_price(upLimit) +
"\n统计口径:日线最高价与收盘价"
) :
(
"涨停事件\n涨停价:" +
f_price(upLimit) +
"\n统计口径:当前K线收盘达到涨停价(当日首次标记)"
)
if lastUpEventLabelTime == time and
not na(lastUpEventLabel)
label.set_xy(
lastUpEventLabel,
time,
upEventLabelY)
label.set_text(
lastUpEventLabel,
upEventText)
label.set_tooltip(
lastUpEventLabel,
tip)
label.set_color(
lastUpEventLabel,
thisUpLabelColor)
label.set_textcolor(
lastUpEventLabel,
eventTextColor)
else
lastUpEventLabel :=
label.new(
x = time,
y = upEventLabelY,
text = upEventText,
xloc = xloc.bar_time,
yloc = isOneDayChart ?
yloc.price :
yloc.abovebar,
style = label.style_label_down,
color = thisUpLabelColor,
textcolor = eventTextColor,
size = f_textSize(eventLabelSizeInput),
tooltip = tip)
lastUpEventLabelTime := time
if intradayAtLeast1m
intradayUpLabelShownToday := true
// ─────────────────────────────────────────────────────────────────────────────
// 跌停 / 翘板标签
// 标签颜色只使用 downLabelColor / eventWarnColor
// 不使用 downBodyColor
// ─────────────────────────────────────────────────────────────────────────────
if showEventLabels and
limitModuleSupported and
inLookback and
showThisDownEventLabel
color thisDownLabelColor =
downEventText == "翘板" ?
eventWarnColor :
downLabelColor
string tip =
isOneDayChart ?
(
"跌停事件\n状态:" +
currentDownStatus +
"\n跌停价:" +
f_price(downLimit) +
"\n统计口径:日线最低价与收盘价"
) :
(
"跌停事件\n跌停价:" +
f_price(downLimit) +
"\n统计口径:当前K线收盘达到跌停价(当日首次标记)"
)
if lastDownEventLabelTime == time and
not na(lastDownEventLabel)
label.set_text(
lastDownEventLabel,
downEventText)
label.set_tooltip(
lastDownEventLabel,
tip)
label.set_color(
lastDownEventLabel,
thisDownLabelColor)
label.set_textcolor(
lastDownEventLabel,
eventTextColor)
else
lastDownEventLabel :=
label.new(
x = time,
y = low,
text = downEventText,
xloc = xloc.bar_time,
yloc = yloc.belowbar,
style = label.style_label_up,
color = thisDownLabelColor,
textcolor = eventTextColor,
size = f_textSize(eventLabelSizeInput),
tooltip = tip)
lastDownEventLabelTime := time
if intradayAtLeast1m
intradayDownLabelShownToday := true
// ─────────────────────────────────────────────────────────────────────────────
// 06. 连板:每段连续涨停只保留一组连接线(1日图)
// ─────────────────────────────────────────────────────────────────────────────
var int streakStartTime = na
var float streakStartLabelY = na
var float streakMaxLabelY = na
var line streakLeftLine = na
var line streakTopLine = na
var line streakRightLine = na
var label streakCountLabel = na
if isOneDayChart and inLookback
if dayUpLocked
int streakOnThisBar =
completedUpStreak + 1
if streakOnThisBar == 1 or
na(streakStartTime)
streakStartTime := time
streakStartLabelY := upEventLabelY
streakMaxLabelY := upEventLabelY
else
streakMaxLabelY :=
math.max(
streakMaxLabelY,
upEventLabelY
)
if showStreakLines and
streakOnThisBar >= 2
float labelHeightClearance =
math.max(
dailyVisualRange * 0.75,
math.max(
math.abs(high) * 0.03,
syminfo.mintick * 30
)
)
float bracketHeight =
math.max(
dailyVisualRange * 0.35,
math.max(
math.abs(high) * 0.012,
syminfo.mintick * 12
)
)
float leftLabelTopY =
streakStartLabelY +
labelHeightClearance
float rightLabelTopY =
upEventLabelY +
labelHeightClearance
float bridgeY =
math.max(
streakMaxLabelY +
labelHeightClearance,
math.max(
leftLabelTopY,
rightLabelTopY
)
) +
bracketHeight
int midTime =
int(
math.floor(
(streakStartTime + time) / 2.0
)
)
if na(streakLeftLine)
streakLeftLine :=
line.new(
x1 = streakStartTime,
y1 = leftLabelTopY,
x2 = streakStartTime,
y2 = bridgeY,
xloc = xloc.bar_time,
extend = extend.none,
color = streakLineColor,
style = f_lineStyle(streakLineStyleInput),
width = streakLineWidth)
streakTopLine :=
line.new(
x1 = streakStartTime,
y1 = bridgeY,
x2 = time,
y2 = bridgeY,
xloc = xloc.bar_time,
extend = extend.none,
color = streakLineColor,
style = f_lineStyle(streakLineStyleInput),
width = streakLineWidth)
streakRightLine :=
line.new(
x1 = time,
y1 = bridgeY,
x2 = time,
y2 = rightLabelTopY,
xloc = xloc.bar_time,
extend = extend.none,
color = streakLineColor,
style = f_lineStyle(streakLineStyleInput),
width = streakLineWidth)
streakCountLabel :=
label.new(
x = midTime,
y = bridgeY,
text = str.tostring(streakOnThisBar) + "板",
xloc = xloc.bar_time,
yloc = yloc.price,
style = label.style_none,
color = na,
textcolor = streakTextColor,
size = f_textSize(streakTextSizeInput))
else
line.set_xy1(
streakLeftLine,
streakStartTime,
leftLabelTopY)
line.set_xy2(
streakLeftLine,
streakStartTime,
bridgeY)
line.set_xy1(
streakTopLine,
streakStartTime,
bridgeY)
line.set_xy2(
streakTopLine,
time,
bridgeY)
line.set_xy1(
streakRightLine,
time,
bridgeY)
line.set_xy2(
streakRightLine,
time,
rightLabelTopY)
label.set_xy(
streakCountLabel,
midTime,
bridgeY)
label.set_text(
streakCountLabel,
str.tostring(streakOnThisBar) + "板")
else
streakStartTime := na
streakStartLabelY := na
streakMaxLabelY := na
streakLeftLine := na
streakTopLine := na
streakRightLine := na
streakCountLabel := na
// ─────────────────────────────────────────────────────────────────────────────
// 07. 跳空缺口:开盘相对前一交易日高低点
// 部分回补时,框自动收缩为剩余未回补区域。
// ─────────────────────────────────────────────────────────────────────────────
var array<box> gapBoxes =
array.new<box>()
var array<int> gapDirs =
array.new<int>()
// 1 = 向上缺口
// -1 = 向下缺口
bool canProcessDailyFeatures =
limitModuleSupported
if canProcessDailyFeatures and
newDay and
inLookback and
not na(prevDayHigh) and
not na(prevDayLow) and
not na(prevDayClose)
bool createUpGap =
open >
prevDayHigh +
syminfo.mintick * 0.25
bool createDownGap =
open <
prevDayLow -
syminfo.mintick * 0.25
if createUpGap
box b =
box.new(
left = time,
top = open,
right = time_close,
bottom = prevDayHigh,
xloc = xloc.bar_time,
extend = extend.right,
border_color = na,
border_width = 0,
bgcolor = gapColor)
array.push(
gapBoxes,
b)
array.push(
gapDirs,
1)
if createDownGap
box b =
box.new(
left = time,
top = prevDayLow,
right = time_close,
bottom = open,
xloc = xloc.bar_time,
extend = extend.right,
border_color = na,
border_width = 0,
bgcolor = gapColor)
array.push(
gapBoxes,
b)
array.push(
gapDirs,
-1)
// 始终严格执行当前数量上限
while array.size(gapBoxes) > maxGapCount
box oldBox =
array.shift(gapBoxes)
array.shift(gapDirs)
box.delete(oldBox)
// 数组中只保留仍存在的缺口。
// 完全回补后立即删除,部分回补时只保留剩余区域。
int activeUpGaps = 0
int activeDownGaps = 0
int gapIndex =
array.size(gapBoxes) - 1
while gapIndex >= 0
box b =
array.get(
gapBoxes,
gapIndex)
int dir =
array.get(
gapDirs,
gapIndex)
bool filled = false
if dir == 1
float lower =
box.get_bottom(b)
float remainingTop =
box.get_top(b)
if low <=
lower +
syminfo.mintick * 0.25
filled := true
else
if low <
remainingTop -
syminfo.mintick * 0.25
box.set_top(
b,
math.max(
lower,
low
)
)
activeUpGaps += 1
else
float upper =
box.get_top(b)
float remainingBottom =
box.get_bottom(b)
if high >=
upper -
syminfo.mintick * 0.25
filled := true
else
if high >
remainingBottom +
syminfo.mintick * 0.25
box.set_bottom(
b,
math.min(
upper,
high
)
)
activeDownGaps += 1
if filled
box.delete(b)
array.remove(
gapBoxes,
gapIndex)
array.remove(
gapDirs,
gapIndex)
gapIndex -= 1
// ─────────────────────────────────────────────────────────────────────────────
// 08. TABLE
// 所有数据均对应当前图表周期
// ─────────────────────────────────────────────────────────────────────────────
float periodChangePct =
not na(close[1]) and
close[1] != 0 ?
(
close / close[1] - 1.0
) * 100.0 :
na
float periodAmplitudePct =
not na(close[1]) and
close[1] != 0 ?
(
high - low
) /
close[1] *
100.0 :
na
string tablePeriodText =
timeframe.period
string tableDateText =
timeframe.isintraday ?
str.format_time(
time,
"MM-dd HH:mm",
syminfo.timezone
) :
str.format_time(
time,
"yyyy-MM-dd",
syminfo.timezone
)
color periodDirectionColor =
na(periodChangePct) ?
tableValueColor :
periodChangePct >= 0 ?
tablePositiveColor :
tableNegativeColor
var table infoTable =
table.new(
f_tablePosition(tablePositionInput),
2,
10,
bgcolor = na,
frame_color = tableBorderColor,
frame_width = tableBorderWidth,
border_color = tableBorderColor,
border_width = tableBorderWidth)
if showTable and barstate.islast
string ts =
f_textSize(tableTextSizeInput)
// 0 周期
table.cell(
infoTable,
0,
0,
"周期",
text_color = tableLabelColor,
text_size = ts,
bgcolor = tableBg,
text_halign = text.align_left)
table.cell(
infoTable,
1,
0,
tablePeriodText,
text_color = tableValueColor,
text_size = ts,
bgcolor = tableBg,
text_halign = text.align_right)
// 1 时间
table.cell(
infoTable,
0,
1,
"时间",
text_color = tableLabelColor,
text_size = ts,
bgcolor = tableAltBg,
text_halign = text.align_left)
table.cell(
infoTable,
1,
1,
tableDateText,
text_color = tableValueColor,
text_size = ts,
bgcolor = tableAltBg,
text_halign = text.align_right)
// 2 开盘
table.cell(
infoTable,
0,
2,
"开盘",
text_color = tableLabelColor,
text_size = ts,
bgcolor = tableBg,
text_halign = text.align_left)
table.cell(
infoTable,
1,
2,
f_price(open),
text_color = tableValueColor,
text_size = ts,
bgcolor = tableBg,
text_halign = text.align_right)
// 3 收盘
table.cell(
infoTable,
0,
3,
"收盘",
text_color = tableLabelColor,
text_size = ts,
bgcolor = tableAltBg,
text_halign = text.align_left)
table.cell(
infoTable,
1,
3,
f_price(close),
text_color = periodDirectionColor,
text_size = ts,
bgcolor = tableAltBg,
text_halign = text.align_right)
// 4 最高
table.cell(
infoTable,
0,
4,
"最高",
text_color = tableLabelColor,
text_size = ts,
bgcolor = tableBg,
text_halign = text.align_left)
table.cell(
infoTable,
1,
4,
f_price(high),
text_color = periodDirectionColor,
text_size = ts,
bgcolor = tableBg,
text_halign = text.align_right)
// 5 最低
table.cell(
infoTable,
0,
5,
"最低",
text_color = tableLabelColor,
text_size = ts,
bgcolor = tableAltBg,
text_halign = text.align_left)
table.cell(
infoTable,
1,
5,
f_price(low),
text_color = tableNegativeColor,
text_size = ts,
bgcolor = tableAltBg,
text_halign = text.align_right)
// 6 涨幅
table.cell(
infoTable,
0,
6,
"涨幅",
text_color = tableLabelColor,
text_size = ts,
bgcolor = tableBg,
text_halign = text.align_left)
table.cell(
infoTable,
1,
6,
f_pct(periodChangePct),
text_color = periodDirectionColor,
text_size = ts,
bgcolor = tableBg,
text_halign = text.align_right)
// 7 振幅
table.cell(
infoTable,
0,
7,
"振幅",
text_color = tableLabelColor,
text_size = ts,
bgcolor = tableAltBg,
text_halign = text.align_left)
table.cell(
infoTable,
1,
7,
f_pct(periodAmplitudePct),
text_color = tableValueColor,
text_size = ts,
bgcolor = tableAltBg,
text_halign = text.align_right)
// 8 成交量
table.cell(
infoTable,
0,
8,
"成交量",
text_color = tableLabelColor,
text_size = ts,
bgcolor = tableBg,
text_halign = text.align_left)
table.cell(
infoTable,
1,
8,
f_cnUnit(volume),
text_color = tableValueColor,
text_size = ts,
bgcolor = tableBg,
text_halign = text.align_right)
// 9 成交额
table.cell(
infoTable,
0,
9,
"成交额(估)",
text_color = tableLabelColor,
text_size = ts,
bgcolor = tableAltBg,
text_halign = text.align_left)
table.cell(
infoTable,
1,
9,
f_cnUnit(barEstimatedAmount),
text_color = tableValueColor,
text_size = ts,
bgcolor = tableAltBg,
text_halign = text.align_right)